The
purpose of this experiment was to determine the diameter of the drain hole by
using the concept of Bernoulli principle which states that an increase in velocity of the
fluid is due to a decrease in pressure. This
statement is shown by the following equation in an incompressible fluid flow:
p1 + ρgh1
+ 1/2ρv12
= p2
+ ρgh2
+ 1/2ρv22
V/t=A√2gh
in which V
represents volume, t is time taken, A indicates area of the drain hole, g is
the acceleration due to gravity, and h represents the height of water.
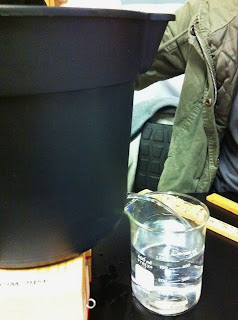
Figure 1: 3 inches height of water in the bucket with a drain hole
Figure 2: Water from the bucket draining into the beaker
Data and Analysis
Uncertainties of each measured value were assumed to be large so that it took account of various errors in this experiment.
Uncertainties of each measured value were assumed to be large so that it took account of various errors in this experiment.
Table 1:
Recorded measurements along with calculate values based on these measurements
Recorded measurements
|
Calculated values
|
||
Volume emptied (ml)
|
473 ± 5
|
Volume emptied (ft3)
|
0.0160 ± 0.0002
|
Diameter of drain hole (cm)
|
0.60 ± 0.01
|
Radius of drain hole (ft)
|
0.0098 ± 0.0016
|
Height of water (in)
|
2.30 ± 0.10
|
Area of drain hole (ft2)
|
3.0x10⁻⁴ ± 1.0x10⁻⁴
|
Height of water (ft)
|
0.192 ± 0.008
|
||
Table-2: Comparison
of experimental and theoretical time taken for 16 ounces (473ml) of fluid to
flow out of the bucket
Trial
|
Time taken(s)
|
Average time taken (s)
|
Theoretical time taken (s)
|
% Error (%)
|
|
1
|
25.06 ± 1.00
|
25.30 ± 1.00
|
15.01 ± 4.93
|
68.55
|
|
2
|
24.85 ± 1.00
|
Smallest possible
|
Largest possible
|
||
3
|
25.24 ± 1.00
|
21.87
|
160.9
|
||
4
|
25.36 ± 1.00
|
||||
5
|
25.17 ± 1.00
|
||||
6
|
26.09 ± 1.00
|
||||
Table-3:
Comparison of the measured and calculated diameter/radius of the drain hole
Measured
|
Calculated
|
% Error (%)
|
|
Diameter (cm)
|
0.60 ± 0.01
|
0.46 ± 0.01
|
29
|
Radius (ft)
|
0.0098 ± 0.0016
|
0.0076 ± 0.0002
|
Discussion
However, as shown in table-3, there was smaller percent error, which was 29%, of the diameter of the drain hole. Again, the measured and the calculated values were not within the uncertainties of each other. This error was also contributed due to inaccuracy in the measurement and the recorded time. In addition, the tape that was used to cover the hole was not fully taken out; hence, it possibly prevented water from flowing out of the bucket. This led to longer time taken to empty 16 ounces of water.
Conclusion
The experimental time taken for
16 ounces of water to flow out of the bucket was 25.30s on average while that
of the theoretical value was 15.01s. This resulted in 68.55% error. Besides,
the percent error of the diameter of the drain hole was 29% with actual
diameter 0.46cm and the measured diameter 0.60cm.


No comments:
Post a Comment