Introduction
The purpose of this experiment was to
understand how different elements only emit certain wavelengths and to identify
an unknown element based on the wavelengths the element emits. This experiment
hired the concept of the light ray diffraction. When a light source is shone
through a slit, different colors with distinct wavelengths interfere
constructively with each other, creating different colors at different
positions. By knowing the distance between the light source and the color of
interest, the wavelength of the interested color can be computed by using λ = Dd/L when the distance
between the light source and the colored filter is very small compared to the
slit. Alternatively, λ =
Dd/√(L2+D2) can be used. The
following image shows the derivation.
Derivation of λ = Dd/√(L2+D2)

This experiment was conducted using
a light source, colored filter, and two 1-meter sticks. The light source was shone
to the colored filter which located 1 meter from the light source. Another 1
meter stick was located beside the colored filter in order to measure the
distance of each color spectrum from the light source. The color spectrum was
seen through the colored filter, and the distance between the light source and
each type of color was recorded. A plot between the experimental and actual
wavelength was constructed in order to made adjustment in further
experimentation. A hydrogen light source was obtained, and the distance of
each color from the light source was measured in same manner. Lastly, an
unknown element light source was obtained to find the wavelength the element
emits. The unknown element was identified based on the wavelengths.
Figure 1: The light spectrum from a white light source
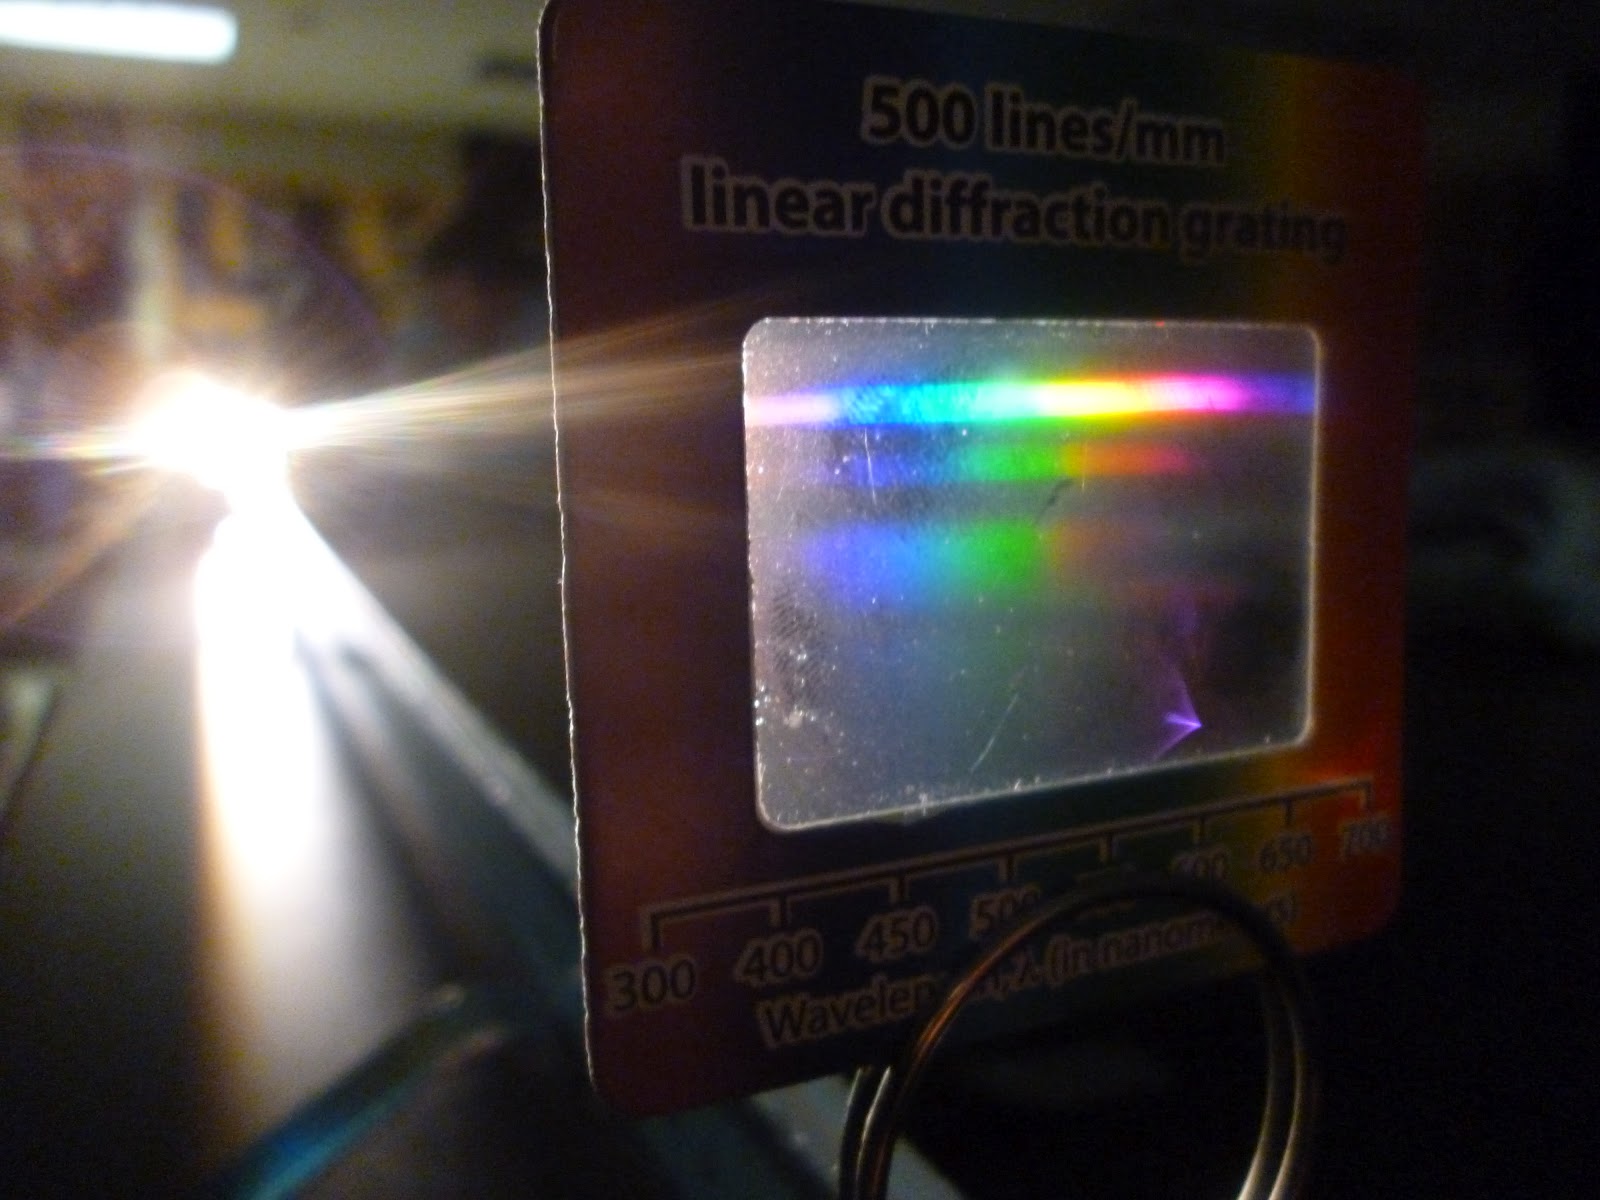


Figure 3: The light spectrum from a neon light source

Data and Analysis
Table 1: Wavelengths of visible light spectrum from a white light
Color
|
Range of the distance between the light source and the light spectra(cm)
|
Average distance(cm)
|
Average experimental wavelength(nm)
|
Average actual wavelength(nm)
|
Violet
|
18.00-22.50 ± 0.50
|
20.25 ± 0.50
|
405 ± 10
|
415
|
Blue
|
22.50-24.20 ± 0.50
|
23.35 ± 0.50
|
467 ± 10
|
463
|
Green
|
24.20-27.50 ± 0.50
|
25.85 ± 0.50
|
517 ± 10
|
533
|
Yellow
|
27.50-30.00 ± 0.50
|
28.75 ± 0.50
|
575 ± 10
|
580
|
Red
|
30.00-38.50 ± 0.50
|
34.25 ± 0.50
|
685 ± 10
|
685
|
Table 2: Wavelengths of visible light spectrum from a H2 light source
Color
|
Distance between the light source and the light spectra(cm)
|
Experimental wavelength(nm)
|
Adjusted experimental wavelength(nm)
|
Actual wavelength(nm)
|
Violet
|
19.90 ± 0.50
|
398 ± 10
|
405 ± 23
|
410
|
Green
|
22.10 ± 0.50
|
442 ± 10
|
449 ± 23
|
434
|
Yellow
|
27.00 ± 0.50
|
540 ± 10
|
545 ± 23
|
486
|
Red
|
31.60 ± 0.50
|
632 ± 10
|
636 ± 23
|
656
|
Table 3: Wavelengths of visible light source from unknown #4 light source
Color
|
Distance between the light source and the light spectra(cm)
|
Experimental wavelength(nm)
|
Adjusted experimental wavelength(nm)
|
Violet
|
23.40 ± 0.50
|
468 ± 10
|
474 ± 23
|
Green
|
27.20 ± 0.50
|
544 ± 10
|
549 ± 23
|
Yellow
|
29.90 ± 0.50
|
598 ± 10
|
602 ± 23
|
Orange
|
31.10 ± 0.50
|
622 ± 10
|
626 ± 23
|
Red
|
33.00 ± 0.50
|
660 ± 10
|
663 ± 23
|
Graph 1: Experimental vs. Actual wavelength

According to table 1, the experimental wavelengths were within the uncertainty of experimental errors, except the green spectrum. When the experimental vs. the actual wavelength was constructed as in graph 1, the relationship between the experimental and actual wavelength was obtained. This was used to obtain wavelengths that would be within visible range when spectrum from hydrogen and unknown light source were computed. As shown in table 2, the violet spectrum from the hydrogen gas was not within the range of visible light. After computing using the equation between the experimental and actual relationship, all of the wavelengths became within the visible range. Additionally, the adjusted wavelengths became within the uncertainty, except the yellow spectrum. This error was possibly contributed because the range of distinct color of light did not appear clearly. Hence, there were uncertainty in measurement of the distance between the light source and the color spectrum.
Based on the wavelengths obtained from unknown light source as shown in table 3, the unknown gas #4 was identified to be neon gas since the peak wavelengths matched the neon spectrum most among the different elements in the periodic table. the neon light spectrum is shown in figure 3.
No comments:
Post a Comment