Tuesday, June 12, 2012

Finding Planck's Constant

Introduction
                   The purpose of this experiment is to determine the planck's constant using the combination of electromagnetic radiation and conduction in solids, specifically p-n junction, concepts.
                   This experiment was conducted using a yellow and blue LED, a power supply, 2 wires, a 150 ohm resistor, and a multimeter. The power supply was connected in series with the LED and the resistor. A supplied voltage was given from the power supply, and the voltage through the LED was measured using the multimeter. The voltage drop was computed by subtracting the voltage across the LED from the supply voltage. A wavelength vs. c/E was constructed in order to determine the experimentally determined planck's constant.
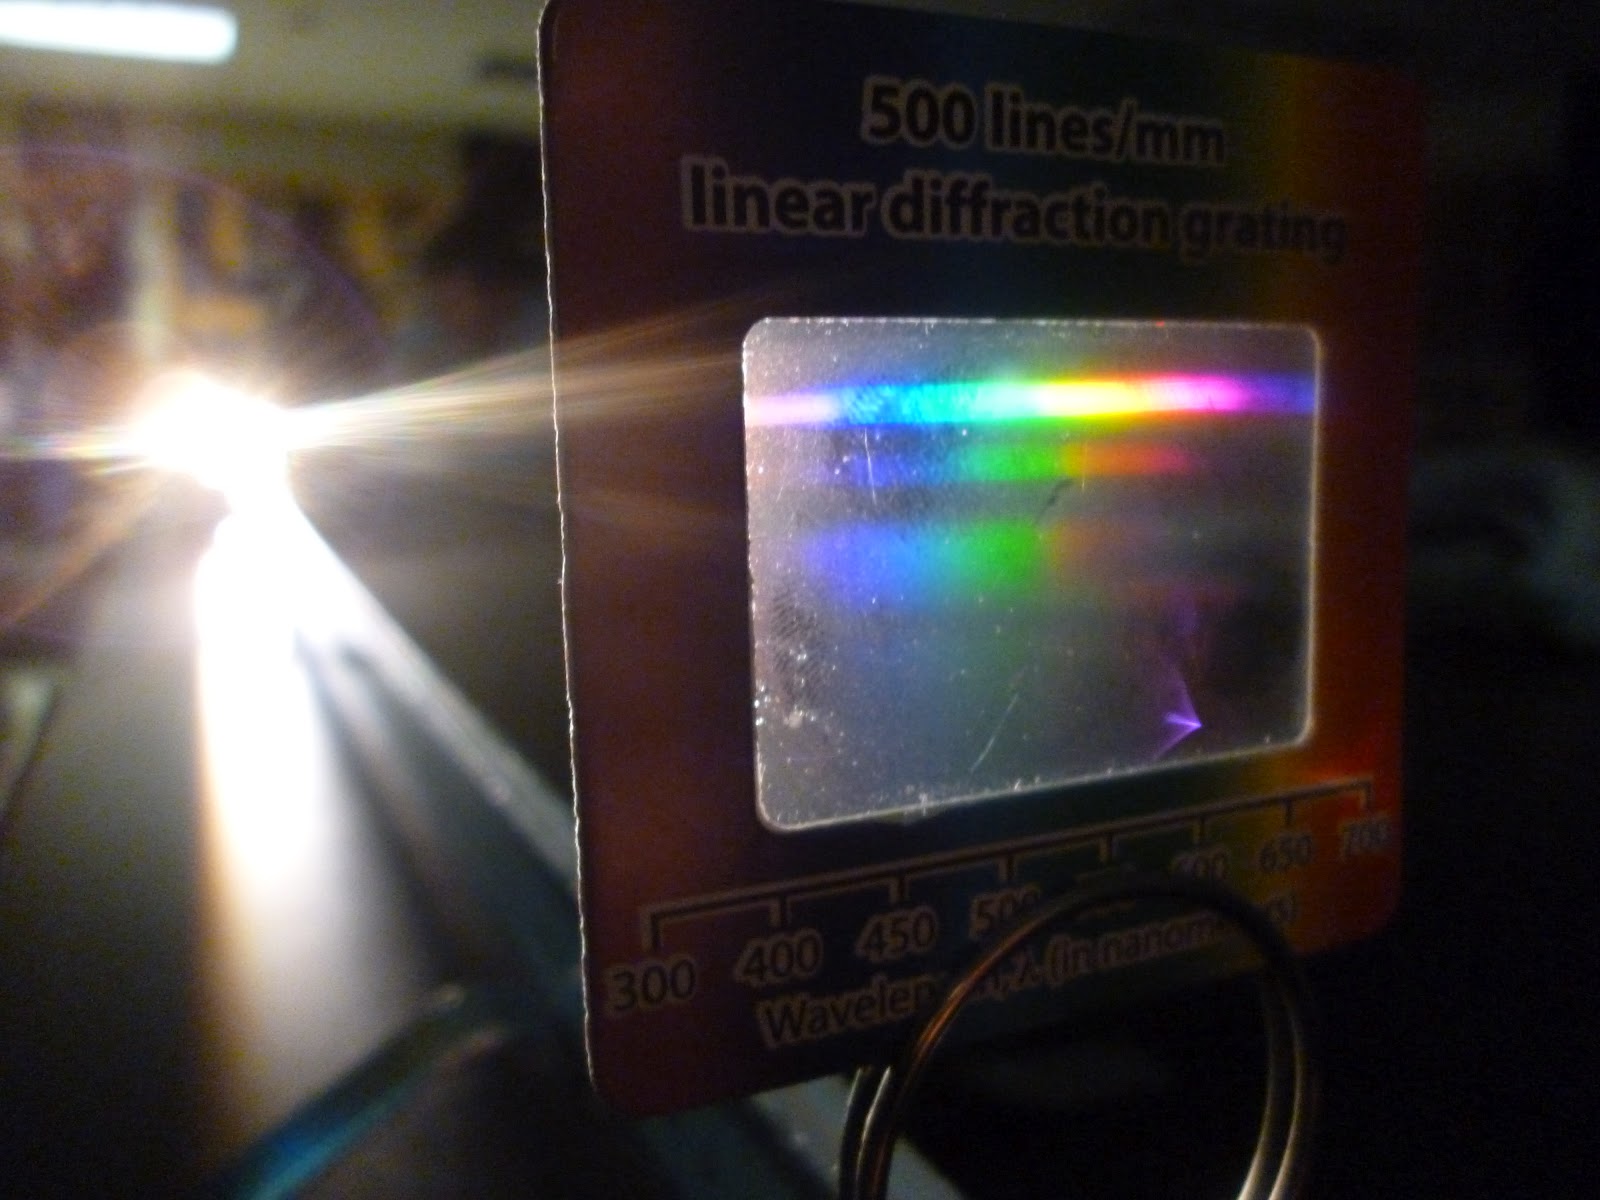
 Figure 1: Blue and yellow light emitted from the LED when a power supply was given
Data and Analysis
Table 1: Data including the voltages and wavelength 
Color
Wavelength (nm)
Vsupply (V)
VLED (V)
Vdrop (V)
Yellow
590 ± 10
3.05 ± 0.01
1.95 ± 0.01
1.10 ± 0.01
Blue
450 ± 10
3.05 ± 0.01
2.76 ± 0.01
0.29 ± 0.01
4.50 ± 0.01
3.00 ± 0.01
1.50 ± 0.01

Graph 1: Wavelength vs. c/E without taking uncertainty into account
Graph 2: Wavelength vs. c/E with uncertainty
Table 2: Comparison of the value of the planck's constant 
Experimental h
Actual h
% error (%)
5 x 10-34
6.63 x 10⁻³⁴
24.6

Conclusion
                    According to the graph 1, the slope is determined to be 5x10-34, which was the experimentally found planck's constant. However, the result was not very accurate since not enough data was collected in order to get a greater precision in the measurements. In addition, the wavelength were not accurate since these wavelengths were estimated based on the closest spectrum of light each LED emitted. These error contributed to total percent error of 24.6%. Yet, the value appeared to have same order of magnitude with the planck's constant. When the graph was reconstructed by including uncertainty (590nm became 600nm, and 450nm became 440 nm), the slope became 6x10-34 as shown in graph 2. This showed that more trials could lower the uncertainty and gave the planck's constant closer to its actual value.

Wednesday, May 30, 2012

Experiment 15: LASER

Introduction
                   The purpose of this experiment is to understand how a laser works by investigating the difference between the spontaneous and stimulated emission. This experiment was conducted by using animations of light absorption and emission from a laser on Modern Physics website.
Clink here to go to "The Laser" page
Images
Figure 1: Absorption
 Figure 2: Spontaneous Emission
Figure 3: Stimulated Emission

Discussion
                  According to figure 1, it reveals that the number of photons (Nin) is equal to the addition of the number of photons out (Nout) and the number of electrons in the excited state (n2). Specifically, 15=1+14. In addition, as shown in figure 2, the emission of photons from these excited states does not have a preferred direction, and the lifetime of each excited state is unpredictable. However, when a photon interacts with an excited electron, the emitted photons are in same direction, phase, and polarization. This is because the incident photon has the same frequency that the excited electron is needed to emit a photon. Therefore, the input of one photon stimulates the emission of another photon along with the incident photon as shown in figure 3. Therefore, the light is being amplified. In order to achieve a population inversion, where the number of excited atoms is more than that of the ground state atoms, the rate of pumping level has to be large enough so that the stimulated emission dominates. By changing the pumping level from 0 to 100, we found that the pumping level at least 70 is required to achieve this population inversion. If one of the photons are emitted in another direction, not aligned with the incident photon, it is possible that the photon is emitted spontaneously.

Monday, May 21, 2012

Experiment 14: Color and Spectra

Introduction
The purpose of this experiment was to understand how different elements only emit certain wavelengths and to identify an unknown element based on the wavelengths the element emits. This experiment hired the concept of the light ray diffraction. When a light source is shone through a slit, different colors with distinct wavelengths interfere constructively with each other, creating different colors at different positions. By knowing the distance between the light source and the color of interest, the wavelength of the interested color can be computed by using λ = Dd/L when the distance between the light source and the colored filter is very small compared to the slit. Alternatively, λ = Dd/(L2+D2) can be used. The following image shows the derivation.  
Derivation of λ = Dd/(L2+D2)
This experiment was conducted using a light source, colored filter, and two 1-meter sticks. The light source was shone to the colored filter which located 1 meter from the light source. Another 1 meter stick was located beside the colored filter in order to measure the distance of each color spectrum from the light source. The color spectrum was seen through the colored filter, and the distance between the light source and each type of color was recorded. A plot between the experimental and actual wavelength was constructed in order to made adjustment in further experimentation. A hydrogen light source was obtained, and the distance of each color from the light source was measured in same manner. Lastly, an unknown element light source was obtained to find the wavelength the element emits. The unknown element was identified based on the wavelengths.
Figure 1: The light spectrum from a white light source
Figure 2: The unknown light source (left) and the light spectrum from the unknown light source (right)
Figure 3: The light spectrum from a neon light source

Data and Analysis
Table 1: Wavelengths of visible light spectrum from a white light
Color
Range of the distance between the light source and the light spectra(cm)
Average distance(cm)
Average experimental wavelength(nm)
Average actual wavelength(nm)
Violet
18.00-22.50 ± 0.50
20.25 ± 0.50
405 ± 10
415
Blue
22.50-24.20 ± 0.50
23.35 ± 0.50
467 ± 10
463
Green
24.20-27.50 ± 0.50
25.85 ± 0.50
517 ± 10
533
Yellow
27.50-30.00 ± 0.50
28.75 ± 0.50
575 ± 10
580
Red
30.00-38.50 ± 0.50
34.25 ± 0.50
685 ± 10
685

Table 2: Wavelengths of visible light spectrum from a H­2 light source
Color
Distance between the light source and the light spectra(cm)
Experimental wavelength(nm)
Adjusted experimental wavelength(nm)
Actual wavelength(nm)
Violet
19.90 ± 0.50
398 ± 10
405 ± 23
410
Green
22.10 ± 0.50
442 ± 10
449 ± 23
434
Yellow
27.00 ± 0.50
540 ± 10
545 ± 23
486
Red
31.60 ± 0.50
632 ± 10
636 ± 23
656

Table 3: Wavelengths of visible light source from unknown #4 light source
Color
Distance between the light source and the light spectra(cm)
Experimental wavelength(nm)
Adjusted experimental wavelength(nm)
Violet
23.40 ± 0.50
468 ± 10
474 ± 23
Green
27.20 ± 0.50
544 ± 10
549 ± 23
Yellow
29.90 ± 0.50
598 ± 10
602 ± 23
Orange
31.10 ± 0.50
622 ± 10
626 ± 23
Red
33.00 ± 0.50
660 ± 10
663 ± 23
Graph 1: Experimental vs. Actual wavelength
Conclusion
                According to table 1, the experimental wavelengths were within the uncertainty of experimental errors, except the green spectrum. When the experimental vs. the actual wavelength was constructed as in graph 1, the relationship between the experimental and actual wavelength was obtained. This was used to obtain wavelengths that would be within visible range when spectrum from hydrogen and unknown light source were computed. As shown in table 2, the violet spectrum from the hydrogen gas was not within the range of visible light. After computing using the equation between the experimental and actual relationship, all of the wavelengths became within the visible range. Additionally, the adjusted wavelengths became within the uncertainty, except the yellow spectrum. This error was possibly contributed because the range of distinct color of light did not appear clearly. Hence, there were uncertainty in measurement of the distance between the light source and the color spectrum.          
                 Based on the wavelengths obtained from unknown light source as shown in table 3, the unknown gas #4 was identified to be neon gas since the peak wavelengths matched the neon spectrum most among the different elements in the periodic table. the neon light spectrum is shown in figure 3.   

Tuesday, May 15, 2012

Experiment 13: Light and Matter Waves

                        This experiment utilized programming in Vpython to see the light and matter waves behavior in 3 and 2 dimensions. The following is an example of the code used in Vpython to show desired 3 and 2 dimensional images.
__________________________________________________
from visual import *
import pylab as p
import mpl_toolkits.mplot3d.axes3d as p3

wavelength = 4.0e-3
scrnDist = 5.0e-2
scrnWdth = 2.4e-2
srceSepn= 2.4e-2
xs=[0,0]
ys=[-srceSepn/2,srceSepn/2]
A=1
N=100

dX=scrnDist/N
Xcoords=arange(dX,scrnDist+2*dX,dX)
dY=scrnDist/N
Ycoords=arange(-scrnDist/2,scrnDist/2+2*dY,dY)
[xd,yd]=meshgrid(Xcoords,Ycoords)
r1=sqrt((xd-xs[0])**2+(yd-ys[0])**2)
r2=sqrt((xd-xs[1])**2+(yd-ys[1])**2)
E0=A*cos(2*pi*r1/wavelength)/r1+A*cos(2*pi*r2/wavelength)/r2
#print E0

fig=p.figure()
Efield=p3.Axes3D(fig)
Efield.plot_wireframe(xd,yd,E0)
Efield.set_xlabel('Xd')
Efield.set_ylabel('Yd')
Efield.set_zlabel('E0')
fig2=p.figure()
p.contour(xd,yd,E0)
p.show()
_________________________________________________
Images
Figure 1: 3D and 2D electric field plots created by a single light source at different wavelengths: 2mm, 4mm, and 8mm
(wavelength=2mm)
(wavelength=4mm)
(wavelength=8mm)
Based on these 3D and 2D plots, it shows that as the wavelength increases, the intensity becomes stronger, and the peaks of the wave become further apart. The circles on the 2D contour corresponds to the local peak intensity at a certain distance from the source.
Figure 2: 3D and 2D electric field plots created by 2 slits at different    wavelengths: 2mm, 4mm, and 8mm

 (wavelength=2mm)

(wavelength=4mm)

(wavelength=8mm)
(wavelength=4mm with doubled slit separation)
When there is a double slit, the peak intensities become 2 straight across the source. As mentioned previously, the intensity increases with increasing wavelength, but the peak of the intensity become broader at larger wavelength. In other words, the smaller the wavelength, the narrower the peak is. As the slit separation increases, the peaks intensity are further apart. 
                                  Figure 3: Comparison of intensity at different wavelengths

Shorter wavelength                              Longer wavelength
The above figures also show that when wavelength is smaller, the light intensity peaks are narrower than when the wavelength is larger. However, both cases have the same peak intensity. As the pattern moves away from the center, the intensity gets smaller since the interference becomes weaker. The intensity at some points along the screen is zero because the wavelengths interfere destructively at these points.

Friday, April 27, 2012

Relativity of Time and Length

Introduction
                The purpose of this experiment is to understand how the time interval between the occurrence of two events and the length of an object in space depends on the inertial frame of reference. According to the relativity of simultaneity, an observer moving with a constant velocity, comparable to the speed of light, relative to the rest frame sees the clock of the rest frame to run slower. This is demonstrated by the relationship between the time interval of the moving and the stationary light clock,
∆t = γ∆t0,                                             (1)
where ∆t is the time interval of the moving light clock, γ is the Lorentz factor, and ∆t0 is the time interval of the stationary light clock. Not only the time interval but also the observed length differs depending of the frame of reference. An observer moving with a constant velocity relative to the rest frame sees the length of an object to be contracted. This idea is also described by a mathematical relationship,
l= γl0,                                                     (2)
where l represents the length seen by moving observer, and l0 is the length in the rest frame.
                In this experiment, these concepts were explored by using the animations of relativity of time and length on <Modern Physics>. The questions given in this website were used as a tool to analyze these concepts.
Images
Image 1: Image depicting the relativity of time at γ = 1.20
Image 2: Image depicting the relativity of time at γ = 1.12
 Image 3: Image depicting the length contraction at γ = 1.41
 Image 4: Image depicting the length contraction at γ = 1.30

Conclusion
Image 1 and 2 explain the concept of relativity of simultaneity. As shown in image 1, the distance travelled by the moving light clock is larger than that by the stationary light clock. Since the moving light clock is travelling with a constant velocity, the light pulse leaving the green object and coming back to this object happen at different positions in space. Therefore, the path of the light pulse is hypotenuses in the moving light clock. Since its path is hypotenuses, it takes longer time for the moving light clock to do the round-trip than the stationary light clock. If I am riding on the light clock, the time interval of the round-trip of the light pulse does not change because I am moving with the same speed of the light clock. In my frame of reference, the light clock is, in this case, always stationary. Thus, the light pulse leaving the green object and reaching this object will occur at the same point; hence, the time interval, which is 6.67μs, remains unchanged. If the velocity of the light clock decreases, the difference between the stationary and the moving time intervals will decrease since the moving light clock travels less distance. Therefore, the hypotenuses or the distance travelled by the light pulse on the moving light clock will approach that distance by the light pulse on stationary light clock. This is confirmed by image 1 and 2, in which the time interval of the moving light clock in image 1 is 8 μs and that in image 2 is 7.47 μs. Assuming the Lorentz factor relative to the earth is 1.2, the time interval records on earth will be 8μs. This result is confirmed by image 1. Besides, if the time interval of the moving light clock is 7.45μs, the Lorentz factor will become 1.12 as shown in image 2. These differences in time values reveal that the observer moving relative to a rest frame observe the clock of the rest frame to run slower.
Image 3 and 4 explain the length contraction in space. If I am riding on the left end of the light clock, the time interval for a pulse of light to travel to the right end and to reflect to the left end of the light clock will not change whether the light clock is moving or stationary relative to the earth. This is because I am moving with the light clock, so in my frame of reference, the light clock is stationary. Therefore, the time interval will always be 6.67 μs as shown in image 3. However, if I am to measure the time interval on the earth, the light clock is moving with a certain speed in my frame of reference. Then the light pulse has to travel longer than the length of the object; hence, it will take longer time interval for the light pulse to reflect back to the left end of the light clock. This is numerically confirmed by image 3, in which the time interval of the stationary light clock is 6.67 μs and that of the moving light clock is 8 μs. The length of the moving clock shown in image 3 and 4 are smaller than the stationary clock due to length contraction. If the lengths are the same, the round-trip time interval as measured on the earth will not be equal to t0/γ. This is because the light clock is moving with a certain speed, so the time interval will become even greater since it has to travel a greater distance. In mathematical way, in equation 2, γ has to become 1 if the lengths are the same. This will contradict the situation since the light clock is moving with a speed comparable to c; thus, γ cannot equal to 1. If the light clock is 1000m long when measured at rest and the Lorentz factor is 1.3, the earth-bound observer will measure the length to be 749 m as confirmed in image 4. 

Friday, April 13, 2012

Experiment 12: CD Diffraction

Introduction
                The purpose of this experiment is to test a DVD to know whether the distance between the grooves causes distortion to the music. The groove spacing will be computed by employing the reflection-grating concept. The standard groove spacing for a DVD is 740 nm*. The experiment was conducted using a compact disc, a meter stick, a laser pointer, stands, and wood blocks. A compact disc was set up in front of the laser pointer so the laser beam would fall on the disc surface perpendicularly. The disc was adjusted so that the zero order maximum would strike the hold of the laser pointer. The first order maxima were found by putting two wood blocks, aligned with each other on each side of the laser pointer. The perpendicular distance between the screen (wood blocks) and the disc was recorded. The distance between two bright fringes on each side of the laser was also measured. The angle from the zero order maximum to the first order maximum was computed. The distance between the grooves was also calculated, and this value was compared with the standard value.
Figure 1: A compact disk was set up to remain perpendicular to the laser beam
 Figure 2: Laser was adjusted so that the zero order maximum stroke the hole of the laser
 

Data and Analysis
Table 1: Measured and computed data required for the grooves distance calculation
λ (nm)
Distance between the CD and the screen (cm)
Distance between 2 adjacent bright fringes (cm)
Angle between perpendicular line to the CD & the first bright fringe (˚)
632.8
11.70 ± 1.00
19.65 ± 1.00
59.23 ± 0.04
Table 2: Comparison between the experimental and the standard distance between the grooves
Experimental width (nm)
Standard width (nm)
% error (%)
% uncertainty (%)
736.5 ± 19.2
740
0.48
2.6

Uncertainty calculation
Conclusion
                According to table 2, the percent error between the experimental distance between the grooves and the standard values were 0.48% with the experimental distance of 736.5nm. In addition, the standard value was within the uncertainty of experimental error since the percent error was a lot smaller than the percent uncertainty. The error that could possibly contribute to this experimental result was that scratches on the disk and the uncertainties in measurement of the distances.
In order to improve the capacity of the DVD, the DVD can be added more layers. However, these layers have to have different pits so that the incoming waves will not interfere destructively when they reflect from each layer.